UTU SEP Products: Heavy ion fluence
Solar heavy ion fluence model
This calculation tool models solar heavy ion fluence at high energies. Based on pre-calculated tabulated model data, the tool interpolates the fluence for a user-specified mission length. Depending on the mode of operation, the user can also choose from other model parameters, as described in the user instructions below.
The model is based on an analysis of SOHO/ERNE heavy ion measurements between 1997 and 2015. In addition, SEPEM helium reference data (Jiggens et al., 2012, 2018) has been used to account for saturation effects and small data gaps occurring ERNE measurements.
We use the SEP event catalogue (R.130, Paassilta et al., 2017) as the event list for the model. Analysing the waiting times reveals that closely spaced events are not occurring randomly. However, by combining closely spaced events emitted by the same active region at the Sun to single episodes (containing 1-6 events) the random character of the occurrence is recovered and the episode occurrence can be modelled as a Poisson process.
In order to correct for the saturation in ERNE, we calculated SEPEM He fluxes at the model energy channels (13-25 MeV/n, 25-50 MeV/n and 50-100 MeV/n) and renormalized them so that they correspond to ERNE at low flux conditions. We then calculated the ERNE fluences for each ion species i at each energy j and for each episode k. In addition, we calculated "integral" He fluences Fint,k by multiplying the He fluence at each energy channel by the channel width and taking their sum, for both ERNE and renormalized SEPEM. The ratio of the integral fluences, FSint,k / FEint,k, was used as a saturation correction factor for fluences of all ion species i at all energies j.
To make sure that episodes with critical gaps in ERNE measurements do not end up in the fluence analysis, we calculated the ratio Rj,k = FS,Ej,k / FSj,k, where FS,Ej,k is the SEPEM fluence over the part of the episode measured by ERNE, and FSj,k is the total SEPEM fluence over the whole episode, and omitted any episode where Rj,k < 0.5 on any channel j. In the end, we are left with 83 episodes out of the original 101.
The saturation-corrected episode fluences are then sorted in ascending order and assigned probability values according to their rank. Each of these empirical fluence distributions are modelled with exponentially cut-off power law functions. Monte Carlo simulations are performed for missions of various durations and for each duration the fluences of each ion species and energy are tabulated for different confidence levels, yielding the raw data of the model.
User instructions
SEP fluence probability calculator
This tool calculates the probability of exceeding a heavy ion fluence on a mission of a given length. The user can specify the ion species, give the mission duration, choose the energy channel and specify whether the tool should output cumulative fluences over the whole mission or the worst-case event fluences as the abscissa value. The values of mission duration should be between 0.5 and 7 years to ensure functionality of calculator. The energy channels of the tool are
• 13-25 MeV/n, 25-50 MeV/n and 50-100 MeV/n (He) • 25-50 MeV/n and 50-100 MeV/n (C, N and O) • 50-100 MeV/n (others)
When using valid parameters, for example a 4-year mission for oxygen at 25-50 MeV/n, the result should look like this:
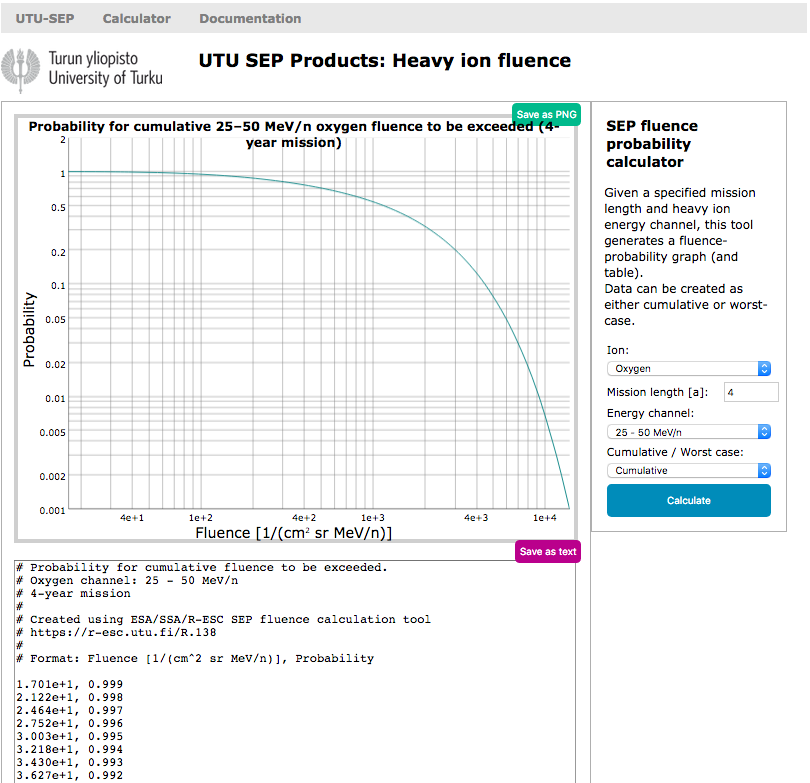
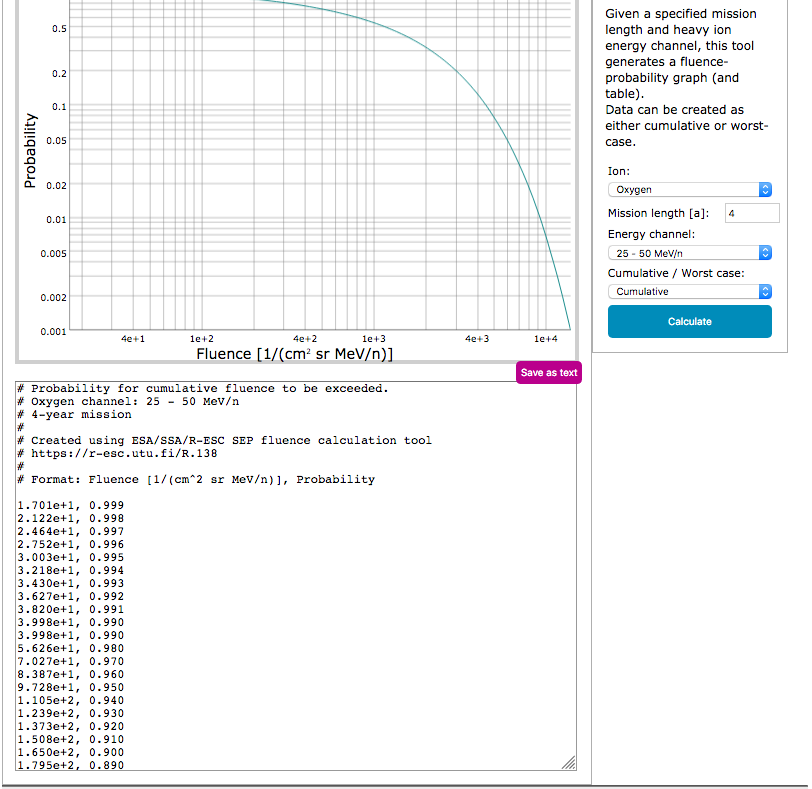
The user can hover over the plot area and read the values of the points closest to the cursor on the screen. The plot, once created, can also be saved as a PNG file using the button on the right. Alternatively, the raw data of the plot in numeric format can be copied and pasted out from the text field below the plot area, or downloaded as a text file using the "Save as text"-button.
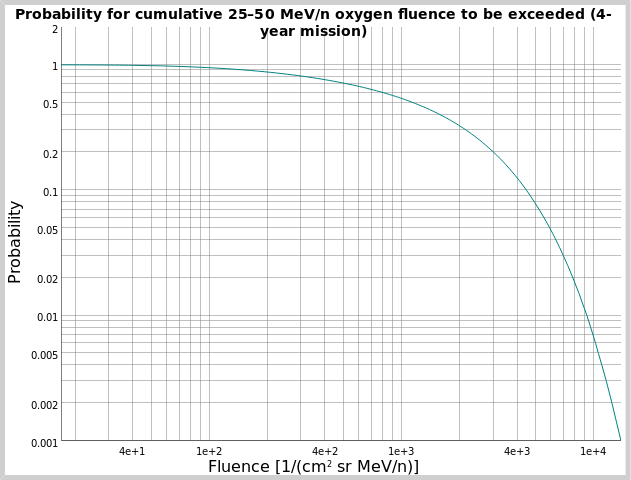
In case you click the green button to save the PNG file, either a file download dialog appears or the plot is downloaded automatically into the default download folder, depending on the browser settings. The saved plot should look like this:
Machine-to-machine interface
The machine-to-machine interface (API) to the product is provided as a web page located at
https://r-esc.utu.fi/api/R.138/probability?<parameter_list>
The <parameter_list> is explained below. The output of the API is a csv file identical to the GUI except for the header part, which is omitted.
The calculator has four parameters.
| Parameter name | Type | Range / allowed values | Description |
|---|---|---|---|
| ion | string | “helium”, “carbon”, “nitrogen”, “oxygen”, “neon”, “magnesium”, “silicon”, “sulfur”, “argon”, “calcium”, “chromium” or “iron” | Ion selector |
| mission_length | float | 0.5 — 7.0 | Mission duration in years |
| energy_channel | integer |
1, 2 or 3 for “helium”. 2 or 3 for “carbon”, “nitrogen” and “oxygen”. 3 for “neon”, “magnesium”, “silicon”, “sulfur”, “argon”, “calcium”, “chromium” and “iron” |
Energy channel index (see below for corresponding MeV/n values) |
| mode | string | “cumulative” or “worstcase” | Output mode selector between cumulative fluences and worst-case event fluences |
energy_channel value index correspondence to MeV/n value:
| energy_channel | Description |
|---|---|
| 1 | 13 — 25 MeV/n |
| 2 | 25 — 50 MeV/n |
| 3 | 50 — 100 MeV/n |
For example, acquiring the worst-case iron fluence probability distribution in energy channel 3 for a two-year mission, access the following web page:
https://r-esc.utu.fi/api/R.138/probability?ion=iron&mission_length=2.0&energy_channel=3&mode=worstcase
References
Jiggens P. et al., 2012, IEEE Transactions on Nuclear Science, 4, 59Jiggens P. et al., 2018, Journal of Space Weather and Space Climate, 8, A31
Paassilta M. et al., 2017, Journal of Space Weather and Space Climate, 7, A14