UTU SEP Products: Proton peak flux
SEP peak flux model
This calculation tool models solar energetic particle (SEP) peak flux at very high energies. Based on pre-calculated tabulated model data, the tool interpolates the proton peak flux for a user-specified mission length. Depending on the mode of operation, the user can also choose from other model parameters, as described in the user instructions below.
The model is based on the observations of the GOES/HEPAD detector in three differential proton channels with nominal energy ranges 330-420 MeV (P8), 420-510 MeV (P9) and 510-700 MeV (P10). The observations span 32 years (1986-2017) and contain observations from several spacecraft from GOES-6 to GOES-15. Spikes and dropouts were cleaned from the original 5-minute fluxes, and 30-minute fluxes were calculated by averaging from the cleaned 5-min data. SEP events are searched from the 30-minute fluxes in the following way: if at least 12 consecutive fluxes (6 hours) are greater than μ24h + 0.82σ24h, where μ24h is the 24 hour mean and σ24h is the 24 hour standard deviation, the period in question is marked as an event. This criterion is used for all three channels, and the resulting combined event list is checked visually against the flux time series to remove events which may have been found accidentally because of, e.g., Forbush decreases caused by events at lower energies or because of change of spacecraft.
Solar event associations for the events are taken from previously published lists (Papaioannou et al., 2016; Paassilta et al., 2017; Raukunen et al., 2018) and the NOAA X-ray flare list. Using this information the successive events which are emitted from the same solar active region are combined to episodes, recovering the random nature of the occurrence. Analysing the waiting time distribution of the episodes shows that the occurrence can be modelled as a Poisson process.
The episode fluxes were processed using a method based on a so-called bow-tie analysis of the characteristic energy in each channel and the corresponding geometric factor (Raukunen et al. 2020). The analysis is based on the calibrated response functions of two HEPAD units, representative of those flown on GOES-6 and later ones, respectively. Peak fluxes at logarithmically spaced energies (405 MeV, 500 MeV and 620 MeV) were calculated by interpolation from the background-substracted fluxes. Background substraction was performed on the episode fluxes using the mean flux of the 24 hours preceding the episode, or if the episode occurs less than 11 days after the previous event, then using the background of the previous episode.
Cumulative probability distributions have been calculated for each channel for both 5 minute and 1 hour (moving average) fluxes. The distributions are modelled with exponentially cut-off power law functions. Monte Carlo simulations are performed for missions of various durations and for each duration the peak fluxes are tabulated for different confidence levels, yielding the raw data of the model.
User instructions
SEP peak flux probability calculator
This tool calculates the probability of exceeding a proton peak flux on a mission of a given length. The user can specify the flux-averaging time (5 minutes / 1 hour), give the mission duration in years, and choose the energy channel from three options. The values of mission length should be between 0.5 and 7 years to ensure functionality of calculator.
When using valid parameters (e.g., 5-minute averaging time, mission length of 2 years, energy channel P8: 405 MeV), the result should look like this:
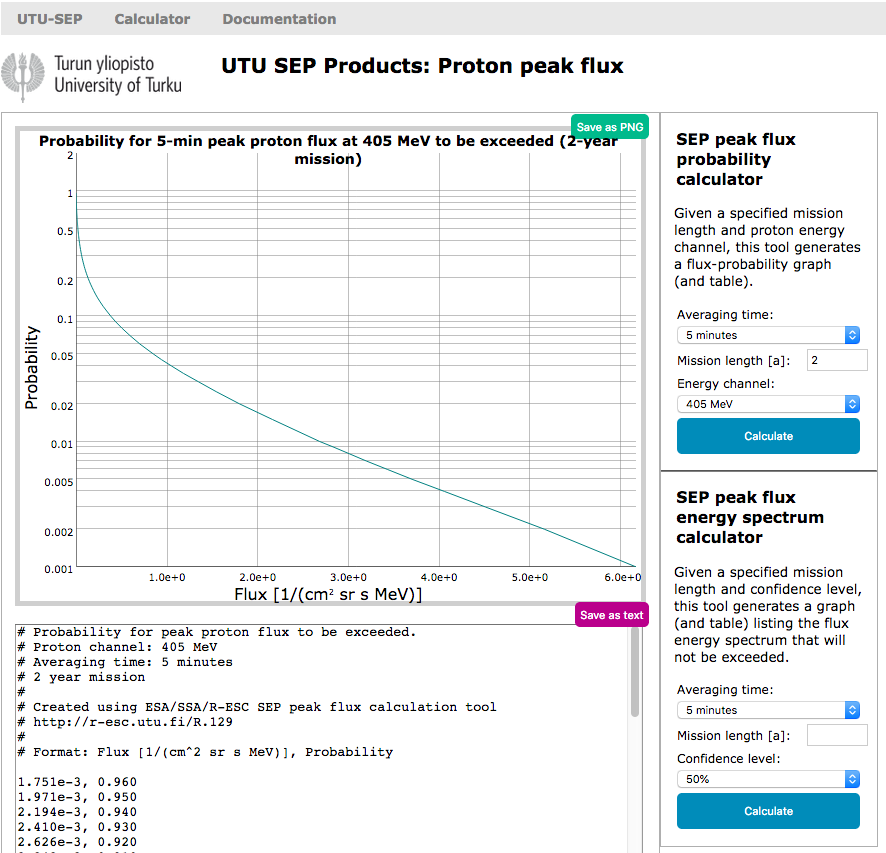
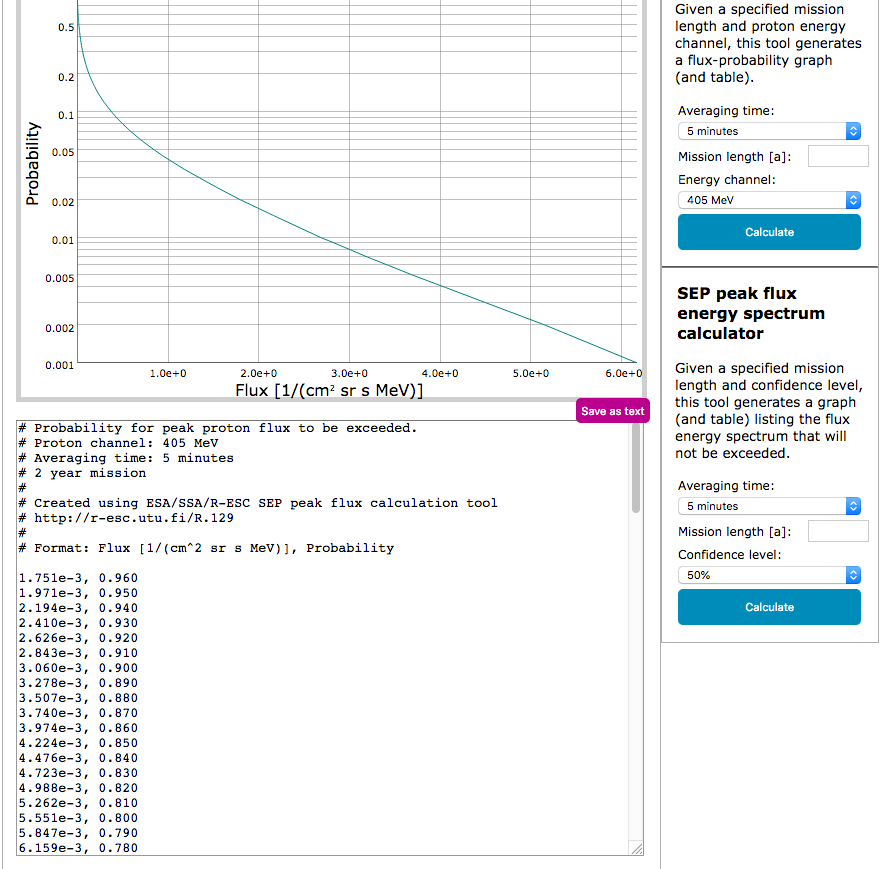
The user can hover over the plot area and read the values of the points closest to the cursor on the screen. The plot, once created, can also be saved as a PNG file using the button on the right. Alternatively, the raw data of the plot in numeric format can be viewed in the text field below the plot area or saved as text using a button in the upper right corner of the area.
In case you click the green button to save the PNG file, the image appears in a new window:
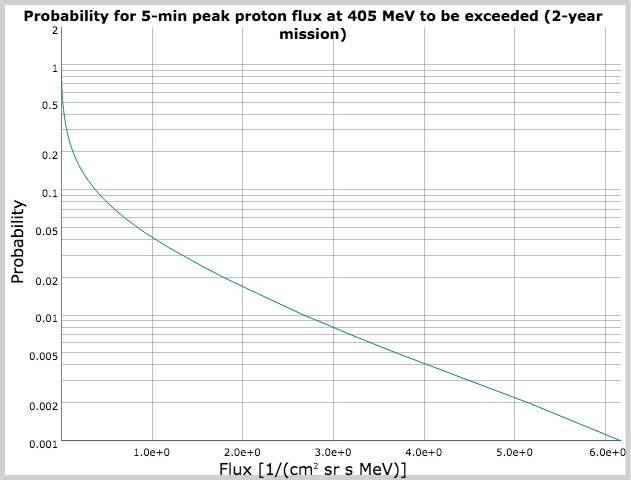
You can then right-click on it and choose to save it in a file.
SEP peak flux energy spectrum calculator
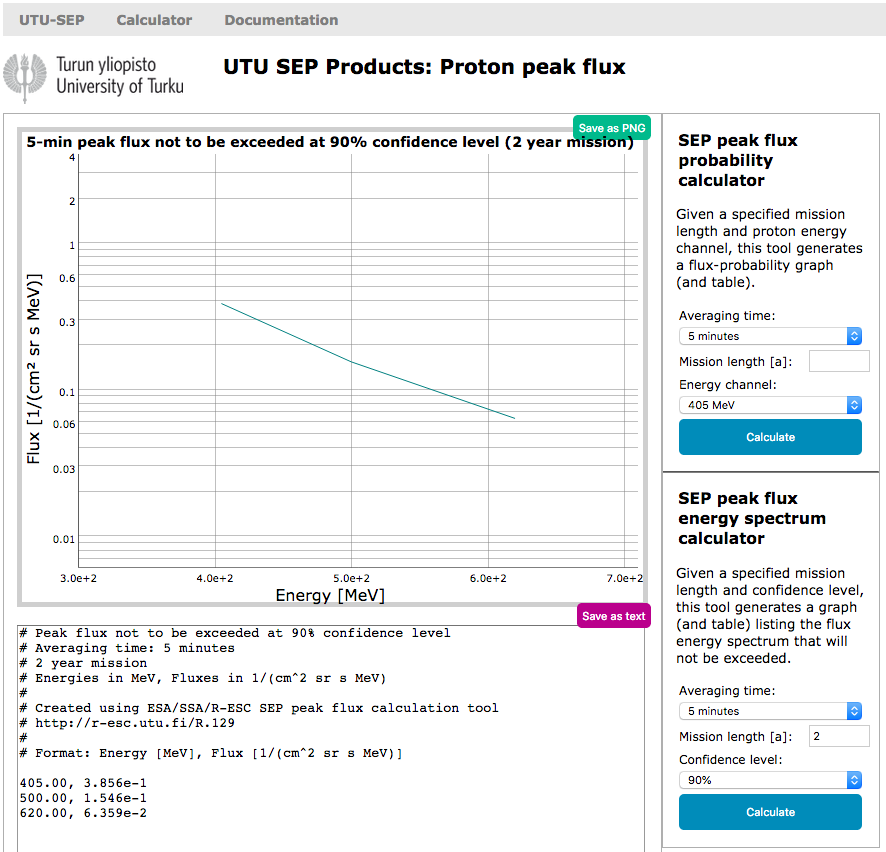
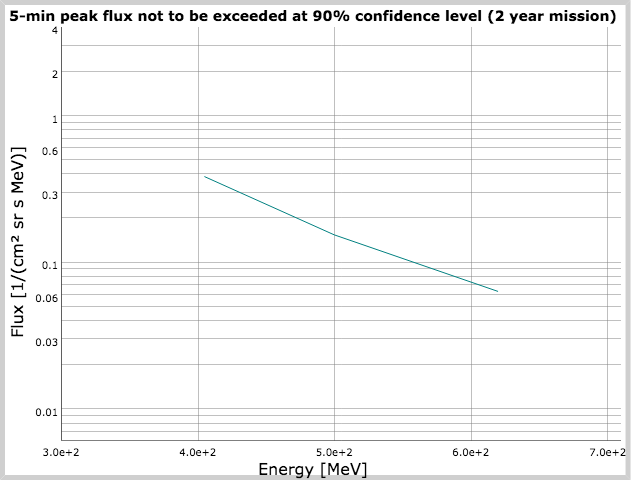
This tool calculates the energy spectrum of the proton peak flux not to be exceeded during the mission. The user can specify the flux-averaging time (5 minutes / 1 hour), the mission duration, and choose the confidence level from four options (50%, 90%, 95%, and 99%). The values of mission length should be between 1 and 7 years, to ensure functionality of calculator.
The tool gives the differential proton peak flux as a function of average energy of the channel. An example of such a proton peak flux energy spectrum (5-minute average, a mission length of 2 years, and a confidence level of 90%) is given below:
Machine-to-machine interfaces
The machine-to-machine interface (API) to the product is provided as a web page located at
https://r-esc.utu.fi/api/R.129/<calculator_type>?<parameter_list>
where <calculator_type> is either the string ‘probability’ or the string ‘energy’ and the <parameter_list> is explained below. In all cases the output of the API is a csv file identical to the GUI except for the header part, which is omitted.
The probability calculator has three parameters.
| Parameter name | Type | Range / allowed values | Description |
|---|---|---|---|
| averaging_time | string | “5min” or “1hour” | Length of the window used when averaging |
| mission_length | float | 0.5 — 7.0 | Mission duration in years |
| energy_channel | integer | 1 — 3 |
Energy channel index (see below for corresponding MeV values) |
energy_channel value index correspondence to energy value:
| energy_channel | Description |
|---|---|
| 1 | 405 MeV |
| 2 | 500 MeV |
| 3 | 620 MeV |
For example, acquiring the 5-minute-averaged peak flux probability distribution at 620 MeV for a two-year mission, access the following web page:
https://r-esc.utu.fi/api/R.129/probability?averaging_time=5min&mission_length=2.0&energy_channel=3
The energy spectrum calculator has three parameters.
| Parameter name | Type | Range / allowed values | Description |
|---|---|---|---|
| averaging_time | string | “5min” or “1hour” | Length of the window used when averaging |
| mission_length | float | 1.0 — 7.0 | Mission duration in years |
| confidence | string | “50”, “90”, “95” or “99” | Confidence level in percentages |
For example, acquiring the 1-hour-averaged peak flux energy spectrum with 90% confidence level for a five-year mission, access the following web page:
https://r-esc.utu.fi/api/R.129/energy?averaging_time=1hour&mission_length=5.0&confidence=90
References
Paassilta et al., 2017, Journal of Space Weather and Space Climate, 7, A14Papaioannou et al., 2016, Journal of Space Weather and Space Climate, 6, A42
Raukunen et al., 2018, Journal of Space Weather and Space Climate, 8, A04
Raukunen et al., 2020, Journal of Space Weather and Space Climate, 10, 24